Different time frame charts

Is it possible to create horizontal lines (S& R) and then convert the chart to a lower TF chart without losing the lines? Example; Can I create an hourly chart with support and resistance lines and then convert it into an 5 minute chart and keep the lines? So far, I have lost the lines when I change the setting from hourly to 5 minutes.
Comments
-
If you are talking about Annotation Horizontal Lines, those are only saved to that specific chart. If you change that chart, the annotations disappear. They are just drawings on that specific chart and if that chart changes, those annotations disappear. You can use the back button on the browser to go back and the annotions should still be there.
I use Horizontal Lines on my charts but they are saved to my chartstyle(s). If you want to, you can add Horizontal Lines using the Overlays section of your chartstyle template.
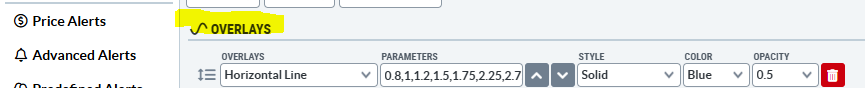
Just add the Horizontal Line and leave the Parameter blank. Save your chartstyle. Then you can look at your chart in the workbench, and add your horizontal lines values in the parameter. Update the chart, then change the Period (time frame) to your other period and those lines will be on the new time frame as well. You can add mulitiple lines by using a comma between your values.
0 -
Thanks, that's new to me. I'll see if I can figure it out.
0 -
I can't seem to find a link to ChartSchool where they talk about the Horizontal Line Overlay, but you can use them on the Price area of the chart as well as on any of the Technical Indicators. I use them on both and find them valuable.
0 -
I like the Horizontal Line feature for oscillators that don't have them built in, like GT industry indicators from Decision Point, e.g here's GT20XLE for the Energy Sector. Note that the stock often rallies after GT20XLE (the red line) crosses below (circled) 20 (the customized green Horizontal Line, not included with the indicator), and tops out when GT20XLE crosses above 80 (not circled). Typical of a range.
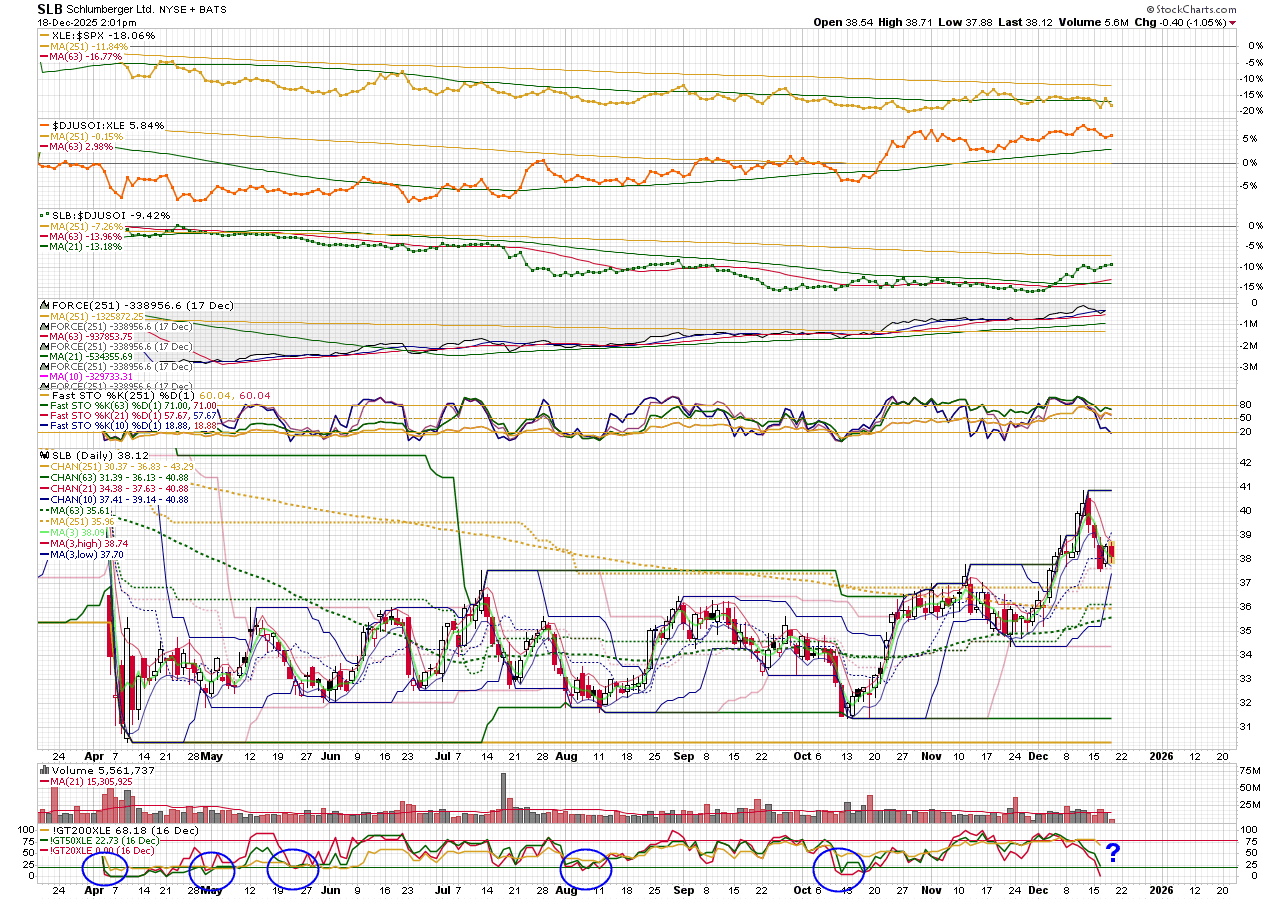
Not 100% reliable, sometimes early or late, but pretty good. Note the x above 80 ISN'T a good sell in Nov/Dec. Maybe a sign that this stock is about to run up. If it is, the Dec x below 20 may be a really good entry set up.
In a trend, the counter trend signals (e.g. below 20 in an up trend) tend to be good (but if the trend is really strong, you may not get a cross below 20), but the trend side crosses (e.g. above 80 in and up trend) are more likely to be early, i.e., the stock keeps going up even after the cross. But, it's probably better not to take serious positions against the trend anyway.
This works with other sectors, too, and seems to work best with larger cap stocks that lead their sectors. May be especially worthwhile if you're an options trader, where timing really matters.
0


Categories
- All Categories
- 2.4K StockCharts
- 397 SharpCharts
- 146 Other Charting Tools
- 69 Saved Charts and ChartLists
- 1.5K Scanning
- 74 Data Issues
- 177 Other StockCharts Questions
- 224 Technical Analysis
- 155 Using Technical Analysis
- 6 InterMarket and International
- 19 Market and Breadth Indicators
- 44 Market Analysis
- 109 Trading
- 109 Trading Strategies
- 162 S.C.A.N the StockCharts Answer Network forum
- 64 Using this StockCharts Answer Network forum
- 98 s.c.a.n. archives
- 7 Off-Topic
- 7 The Cogitation & Rumination Emporium
- Forum Test Area